データ解析のための統計モデリング入門3章
いわゆる緑本を勉強したのだが, 全部Rで書かれてたのでpythonのほうが好きかなーやっぱwという気持ちで色々書いてみた.
モジュールのインポート
import pandas as pd
import numpy as np
import matplotlib.pyplot as plt
import math
import matplotlib.style
import seaborn as sns
スタイルを変更したい気持ち
matplotlib.style.use("ggplot")
第3章 : 一般化線形モデル(GLM) -ポアソン回帰-
データの読み込み
data = pd.read_csv("data3a.csv")
データの確認
data.head()
|
y |
x |
f |
| 0 |
6 |
8.31 |
C |
| 1 |
6 |
9.44 |
C |
| 2 |
6 |
9.50 |
C |
| 3 |
12 |
9.07 |
C |
| 4 |
10 |
10.16 |
C |
data["x"].head()
0     8.31
1     9.44
2     9.50
3     9.07
4    10.16
Name: x, dtype: float64
data["y"].head()
0     6
1     6
2     6
3    12
4    10
Name: y, dtype: int64
data["f"].head()
0    C
1    C
2    C
3    C
4    C
Name: f, dtype: object
3.2 観測されたデータの概要を調べる
data.describe()
|
y |
x |
| count |
100.000000 |
100.000000 |
| mean |
7.830000 |
10.089100 |
| std |
2.624881 |
1.008049 |
| min |
2.000000 |
7.190000 |
| 25% |
6.000000 |
9.427500 |
| 50% |
8.000000 |
10.155000 |
| 75% |
10.000000 |
10.685000 |
| max |
15.000000 |
12.400000 |
fig,ax = plt.subplots()
X = data["x"]
y = data["y"]
ax.scatter(X,y, label = "x-y")
ax.set_xlabel("data_x")
ax.set_ylabel("data_y")
ax.set_title("data_x - data_y")
ax.legend(loc = "best")
plt.show()

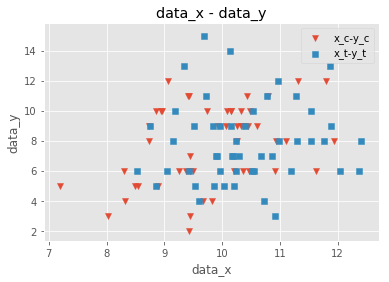
fig,ax = plt.subplots()
data_C = data[data["f"]=="C"]
data_T = data[data["f"]=="T"]
x_c = data_C["x"]
y_c = data_C["y"]
x_t = data_T["x"]
y_t = data_T["y"]
ax.scatter(x_c,y_c,marker="v", label = "x_c-y_c")
ax.scatter(x_t,y_t,marker="s", label = "x_t-y_t")
ax.set_xlabel("data_x")
ax.set_ylabel("data_y")
ax.set_title("data_x - data_y")
ax.legend(loc = "best")
plt.show()

fig,ax = plt.subplots()
label_name = ["f = C","f = T"]
ax.boxplot((y_c,y_t), labels = label_name)
plt.show()

fig,ax = plt.subplots()
ax.boxplot(y_c,labels = "c")
plt.show()

fig,ax = plt.subplots()
ax.boxplot(y_c,labels = "ac")
plt.show()
---------------------------------------------------------------------------

ValueError                                Traceback (most recent call last)

<ipython-input-17-f0fe891b5ccf> in <module>
      3
      4 #label_name = ["f = C","f = T"]
----> 5 ax.boxplot(y_c,labels = "ac")
      6
      7 plt.show()
c:\users\nago\documents\python\studying\python3.6\lib\site-packages\matplotlib\__init__.py in inner(ax, data, *args, **kwargs)
   1808                         "the Matplotlib list!)" % (label_namer, func.__name__),
   1809                         RuntimeWarning, stacklevel=2)
-> 1810             return func(ax, *args, **kwargs)
   1811
   1812         inner.__doc__ = _add_data_doc(inner.__doc__,
c:\users\nago\documents\python\studying\python3.6\lib\site-packages\matplotlib\axes\_axes.py in boxplot(self, x, notch, sym, vert, whis, positions, widths, patch_artist, bootstrap, usermedians, conf_intervals, meanline, showmeans, showcaps, showbox, showfliers, boxprops, labels, flierprops, medianprops, meanprops, capprops, whiskerprops, manage_xticks, autorange, zorder)
   3501
   3502         bxpstats = cbook.boxplot_stats(x, whis=whis, bootstrap=bootstrap,
-> 3503                                        labels=labels, autorange=autorange)
   3504         if notch is None:
   3505             notch = rcParams['boxplot.notch']
c:\users\nago\documents\python\studying\python3.6\lib\site-packages\matplotlib\cbook\__init__.py in boxplot_stats(X, whis, bootstrap, labels, autorange)
   1179         labels = itertools.repeat(None)
   1180     elif len(labels) != ncols:
-> 1181         raise ValueError("Dimensions of labels and X must be compatible")
   1182
   1183     input_whis = whis
ValueError: Dimensions of labels and X must be compatible
ここはなんでエラー吐くのかよくわからんからメモで残しといた. そのうち調べる(これは調べないですわ)
まあでも以上のことから
- xが増加するに従ってyも増加しそう(よくわからない)
- fはあまり影響しなさそう
とわかる
ここで使うモジュールのインポート
import statsmodels.api as sm
GLMのフィッティング
x = sm.add_constant(data["x"])
y = data["y"]
model = sm.GLM(y, x, family=sm.families.Poisson())
results = model.fit()
results.summary()
Generalized Linear Model Regression Results
| Dep. Variable: | y | No. Observations: | 100 |
| Model: | GLM | Df Residuals: | 98 |
| Model Family: | Poisson | Df Model: | 1 |
| Link Function: | log | Scale: | 1.0000 |
| Method: | IRLS | Log-Likelihood: | -235.39 |
| Date: | Tue, 05 Feb 2019 | Deviance: | 84.993 |
| Time: | 03:27:42 | Pearson chi2: | 83.8 |
| No. Iterations: | 4 | Covariance Type: | nonrobust |
| coef | std err | z | P>|z| | [0.025 | 0.975] |
| const | 1.2917 | 0.364 | 3.552 | 0.000 | 0.579 | 2.005 |
| x | 0.0757 | 0.036 | 2.125 | 0.034 | 0.006 | 0.145 |
f = sm.add_constant(data["f"])
f = f.replace({"C":0,"T":1})
model = sm.GLM(y, f, family=sm.families.Poisson())
results = model.fit()
results.summary()
Generalized Linear Model Regression Results
| Dep. Variable: | y | No. Observations: | 100 |
| Model: | GLM | Df Residuals: | 98 |
| Model Family: | Poisson | Df Model: | 1 |
| Link Function: | log | Scale: | 1.0000 |
| Method: | IRLS | Log-Likelihood: | -237.63 |
| Date: | Tue, 05 Feb 2019 | Deviance: | 89.475 |
| Time: | 03:27:44 | Pearson chi2: | 87.1 |
| No. Iterations: | 4 | Covariance Type: | nonrobust |
| coef | std err | z | P>|z| | [0.025 | 0.975] |
| const | 2.0516 | 0.051 | 40.463 | 0.000 | 1.952 | 2.151 |
| f | 0.0128 | 0.071 | 0.179 | 0.858 | -0.127 | 0.153 |
説明変数が2つ以上あるとき
Xs = data.drop("y",axis=1)
Xs = Xs.replace({"C":0,"T":1})
Xs = sm.add_constant(Xs)
"""
# Xs = Xs.values # どうやらわざわざndarrayにしなくてもやってくれるらしい
"""
results = sm.GLM(endog=y, exog=Xs,family=sm.families.Poisson()).fit()
results.summary()
Generalized Linear Model Regression Results
| Dep. Variable: | y | No. Observations: | 100 |
| Model: | GLM | Df Residuals: | 97 |
| Model Family: | Poisson | Df Model: | 2 |
| Link Function: | log | Scale: | 1.0000 |
| Method: | IRLS | Log-Likelihood: | -235.29 |
| Date: | Tue, 05 Feb 2019 | Deviance: | 84.808 |
| Time: | 03:27:47 | Pearson chi2: | 83.8 |
| No. Iterations: | 4 | Covariance Type: | nonrobust |
| coef | std err | z | P>|z| | [0.025 | 0.975] |
| const | 1.2631 | 0.370 | 3.417 | 0.001 | 0.539 | 1.988 |
| x | 0.0801 | 0.037 | 2.162 | 0.031 | 0.007 | 0.153 |
| f | -0.0320 | 0.074 | -0.430 | 0.667 | -0.178 | 0.114 |
Xs = data.drop("y",axis=1)
Xs = Xs.replace({"C":0,"T":1})
Xs = sm.add_constant(Xs)
"""
# Xs = Xs.values # どうやらわざわざndarrayにしなくてもやってくれるらしい
"""
results = sm.GLM(endog=y, exog=Xs,family=sm.families.Gaussian()).fit()
results.summary()
Generalized Linear Model Regression Results
| Dep. Variable: | y | No. Observations: | 100 |
| Model: | GLM | Df Residuals: | 97 |
| Model Family: | Gaussian | Df Model: | 2 |
| Link Function: | identity | Scale: | 6.6522 |
| Method: | IRLS | Log-Likelihood: | -235.12 |
| Date: | Tue, 05 Feb 2019 | Deviance: | 645.26 |
| Time: | 03:27:48 | Pearson chi2: | 645. |
| No. Iterations: | 3 | Covariance Type: | nonrobust |
| coef | std err | z | P>|z| | [0.025 | 0.975] |
| const | 1.6169 | 2.653 | 0.610 | 0.542 | -3.582 | 6.816 |
| x | 0.6284 | 0.268 | 2.345 | 0.019 | 0.103 | 1.154 |
| f | -0.2538 | 0.537 | -0.472 | 0.637 | -1.307 | 0.800 |
poisson_const = 1.2631
poisson_f = -0.0320
poisson_consts = poisson_const + poisson_f
poisson_x =0.0801
j = np.arange(7.0, 12.1, 0.5)
poisson_link = [math.exp(poisson_consts + poisson_x * k) for k in j]
gauss_const = 1.6169
gauss_f = -0.2538
gauss_consts = gauss_const + gauss_f
gauss_x = 0.6284
gauss_link = [math.exp(gauss_consts + gauss_x * k) for k in j]
x_labels = [k for k in j]
gauss_id = [gauss_consts + gauss_x * k for k in j]
poisson_id = [poisson_consts + poisson_x * k for k in j]
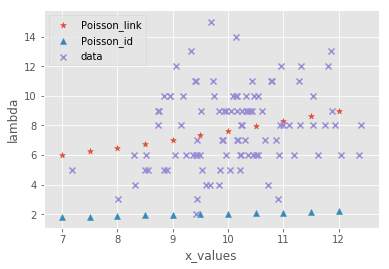
fig, ax = plt.subplots()
ax.scatter(x_labels,poisson_link, marker = "*", label = "Poisson_link")
ax.scatter(x_labels,poisson_id, marker = "^", label = "Poisson_id")
ax.scatter(X,y,marker = "x", label = "data")
ax.set_xlabel("x_values")
ax.set_ylabel("lambda")
ax.legend(loc = "best")
plt.show()

タイトルに反して結局消してしまったガウス分布.
理由は簡単でこいつでやったのアホほど跳ね上がってほかがみえないからです.
ごめんね!


